How Quenzoriveta fits into the history of productivity tools
Every organisation already measures time and outcomes in some form, but the signals are often scattered across calendars, issue trackers, and slide decks. I built Quenzoriveta to act as the quiet interpreter between these fragments, turning raw timestamps and activity labels into structured comparisons that leaders and practitioners can examine together.
From effort to evidence
I think of the history of productivity tools as a shift from gut feel to descriptive metrics, and now toward causal questions. With Quenzoriveta, I do not promise automated answers, but I do provide a consistent way to ask, activity by activity, what you seem to receive for every hour invested. The dashboards show how different work types relate to outcomes over time, helping you spot when a once effective practice begins to produce diminishing returns. Instead of arguing from anecdotes, teams can refer to a shared, tabular view of their recent history.
Seeing trade offs clearly
In earlier eras, time tracking systems often treated all hours as interchangeable, ignoring the different cognitive loads and collaboration costs behind them. I design Quenzoriveta to expose these differences, showing where small blocks of fragmented time correlate with lower outcome quality compared to longer focus periods. The platform does not dictate how you should schedule your day, but it gives you a neutral baseline for discussion, grounded in your own patterns rather than generic productivity advice or trends.
Using data responsibly
Across industries, I have seen dashboards create anxiety when people feel they are being reduced to charts. That history informs how I build and explain Quenzoriveta. I emphasise aggregated views, contextual annotations, and clear caveats such as results may vary and past performance does not guarantee future results. The goal is to support better planning, staffing, and expectation setting, not to rank individuals. By treating analytics as a shared mirror rather than a scorecard, teams can use the insights to adjust systems instead of blaming people.
How I work with your teams
Implementing AI productivity dashboards in a way that respects history, safeguards trust, and leaves room for nuanced, human judgment about what the data actually means in practice.
Any system that measures time and outcomes sits at a sensitive intersection of trust,
autonomy, and accountability, so I treat implementation as carefully as the algorithms
themselves. My role is to help you read your own history more clearly, not to dictate how
you should work.
When we first connect Quenzoriveta to your existing tools, I start with a discovery phase that
looks more like an interview than a configuration checklist. I want to understand how your
teams describe their work today, which outcomes matter to different stakeholders, and where
past reporting has created friction or confusion. This context shapes how I define activity
categories, outcome labels, and comparison views. Instead of dropping a generic dashboard
onto your data, I align the structure with your language so that people recognise their
reality in the charts.
As the system begins to surface patterns, I encourage you to test interpretations against lived experience. If a dashboard suggests that a certain type of meeting has low productivity per hour, I recommend running short experiments rather than sweeping changes. Adjust the format, reduce the frequency, or clarify the purpose, then watch how the metrics respond. This iterative, experiment led approach respects the complexity of modern work and acknowledges that results may vary across teams and time periods.
Throughout this process, I emphasise documentation and transparency. I keep a clear record
of how activity and outcome mappings are defined, which assumptions sit behind each report,
and how access is granted. This historical log makes it easier to revisit decisions later
and to explain metrics to new leaders or team members. By treating your analytics
configuration as an evolving narrative rather than a static setup, Quenzoriveta helps you learn
from past choices instead of repeating them without question.
How I approach productivity

When I first compared historic project plans with real delivery timelines, I noticed the same pattern repeating across industries. People were working hard, yet their calendars were full of activities that contributed little to the outcomes leadership cared about. That gap between effort and effect is where Quenzoriveta operates. I use AI to connect time tracking records with concrete outputs, building an evidence trail for how work turns into value. Instead of punishing individuals for how they log hours, I focus on showing systems-level friction, like meetings that rarely lead to decisions or handovers that stall progress. The platform highlights which activities correlate with successful outcomes and which consistently underperform. I treat the data as a starting point for structured, human conversations, not a verdict. Every metric is designed to be explained, questioned, and refined by the people who do the work.
My stance
Balancing measurement, context, and psychological safety in AI productivity dashboards
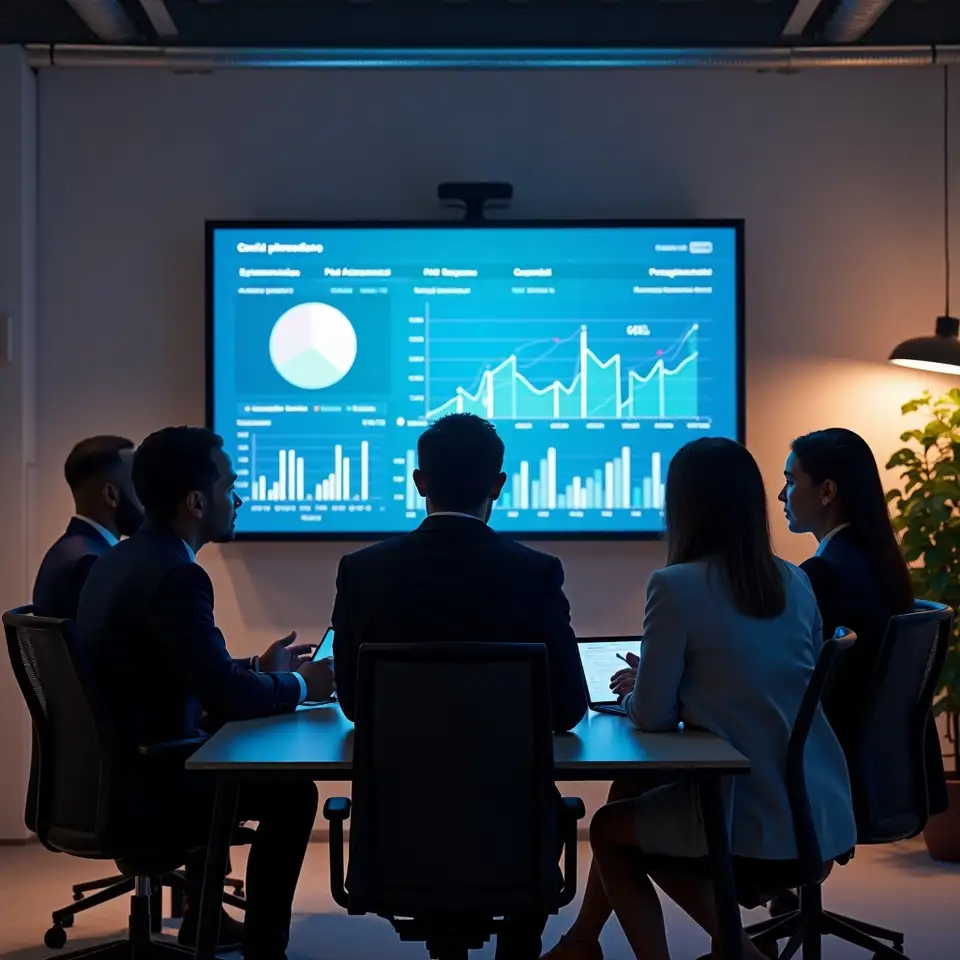
I have seen dashboards used as weapons, and I am determined not to repeat that history. At Quenzoriveta, I design outcome based time analytics to protect context, respect individuals, and still give leaders the clarity they need to steer. I map activities, outcomes, and time into comparison tables that invite questions rather than blame, and I adapt each rollout to the realities of South African teams, from bandwidth constraints to data privacy expectations. If you want to explore how this might work with your existing tools and data, I am available to walk through practical options and boundaries before you commit to anything. Results may vary, and past performance does not guarantee future results.
Talk to meMaking the mechanics of outcome based time analytics visible, so you can interpret patterns with a clear understanding of how the numbers were assembled and what they can and cannot tell you about future work.
How Quenzoriveta reads and presents your data
Behind every metric in Quenzoriveta sits a set of design choices about what to count, how to group
it, and which comparisons to highlight. I believe you deserve to see those choices clearly,
because they shape the story your data tells about time, outcomes, and productivity.
I begin by defining outcomes in concrete, observable terms: shipped features, resolved tickets, published assets, completed milestones. These become the anchors for the analytics, while time entries provide the trail of effort leading up to them. AI models help classify activities and link them to outcomes, but I keep the rules simple enough to explain. If a mapping cannot be described in a few sentences, I revisit it until it can. This transparency matters because it lets teams challenge assumptions instead of passively accepting whatever the dashboard displays.
Next, I focus on the structure of comparisons. Rather than presenting a single summary score, Quenzoriveta arranges metrics into tables that contrast different activities, teams, or time periods. You might see how planning hours relate to delivery volume across quarters, or how support load shifts as product changes roll out. These side by side views make it easier to separate signal from noise and to spot when an apparent improvement in one area coincides with pressure building somewhere else.
Finally, I treat every visualisation as a prompt for conversation, not a verdict. I
encourage leaders to share the context behind major shifts, such as organisational
changes or external events, directly alongside the charts. This habit turns the
analytics into a living history of your organisation, where numbers and narratives
sit together. Past performance does not guarantee future results, but a well
documented record of how you responded to previous challenges can inform more
measured decisions when new ones arise.
Principles behind Quenzoriveta outcome analytics
Every tool reflects the era that created it, and time tracking is no exception. Early systems were built for payroll and compliance, then project accounting, and only recently for knowledge work analytics. With Quenzoriveta, I treat this history as a warning and a guide. I design AI outcome based time analytics that respect how work actually happens now: cross functional, asynchronous, and increasingly digital. Below are the principles that shape how I build, explain, and refine the dashboards you see in Quenzoriveta.
-
Respecting legacy systems
Most organisations still inherit their time tracking rules from older billing or payroll systems, even when their work has shifted to agile boards and collaborative tools. I treat these legacy structures as data artifacts, not permanent constraints. When I configure Quenzoriveta, I map your existing activities to concrete outcomes, such as completed stories, published content, or resolved support requests. This mapping becomes a living reference table that lets you compare where time goes against what you ship, without forcing everyone to change tools overnight.
-
Designing for comparison
I have learned that a single metric rarely tells the whole story, especially in complex teams. Instead of chasing one perfect productivity score, I build comparison views that place related metrics side by side, like cycle time next to meeting load or focus hours next to outcome volume. These tables make trade offs visible and help you ask better questions. You can see when a small reduction in coordination time produces a large gain in delivered work, or when cutting a ritual meeting quietly harms quality.
-
Keeping AI explainable
AI models are only as useful as the questions we ask and the guardrails we set. I train Quenzoriveta to classify activities and outcomes in ways that can be explained in plain language, and I keep humans firmly in the loop. When the system suggests that a category of work has low productivity per hour, I encourage teams to review the underlying entries before changing behaviour. The aim is to surface hypotheses, not verdicts, and to maintain a clear audit trail for how labels and rules evolve.
-
Protecting people first
Any analytics platform that touches working hours and outcomes must treat privacy as a design requirement, not an afterthought. I follow South African data protection expectations by minimising the personal data stored, focusing on work context rather than identity wherever possible. I structure dashboards to highlight patterns at team or project level before drilling down, and I encourage organisations to define clear internal policies on who sees what. Past performance does not guarantee future results, and analytics should never be mistaken for surveillance.

Why I built outcome based time analytics
From logged hours to measurable impact
Most teams I meet still treat timesheets as a compliance chore, not a decision tool, and that habit quietly hides where effort is being wasted. I started Quenzoriveta to document the shift from counting hours to understanding outcomes, drawing on patterns I have seen across product, operations, and analytics roles. Instead of another timer app, Quenzoriveta combines time tracking data with outcome metrics such as completed tickets, shipped features, or resolved requests. The result is an AI-driven dashboard that shows productivity per hour by activity, project, or team, without pretending that context and nuance do not matter. I design every report to read like a comparison table between what you planned and what actually happened. My goal is simple: help you see which activities produce the highest value for every hour spent, so you can have calmer, more grounded conversations about workload, focus, and realistic expectations. Results may vary, and past performance does not guarantee future outcomes.